

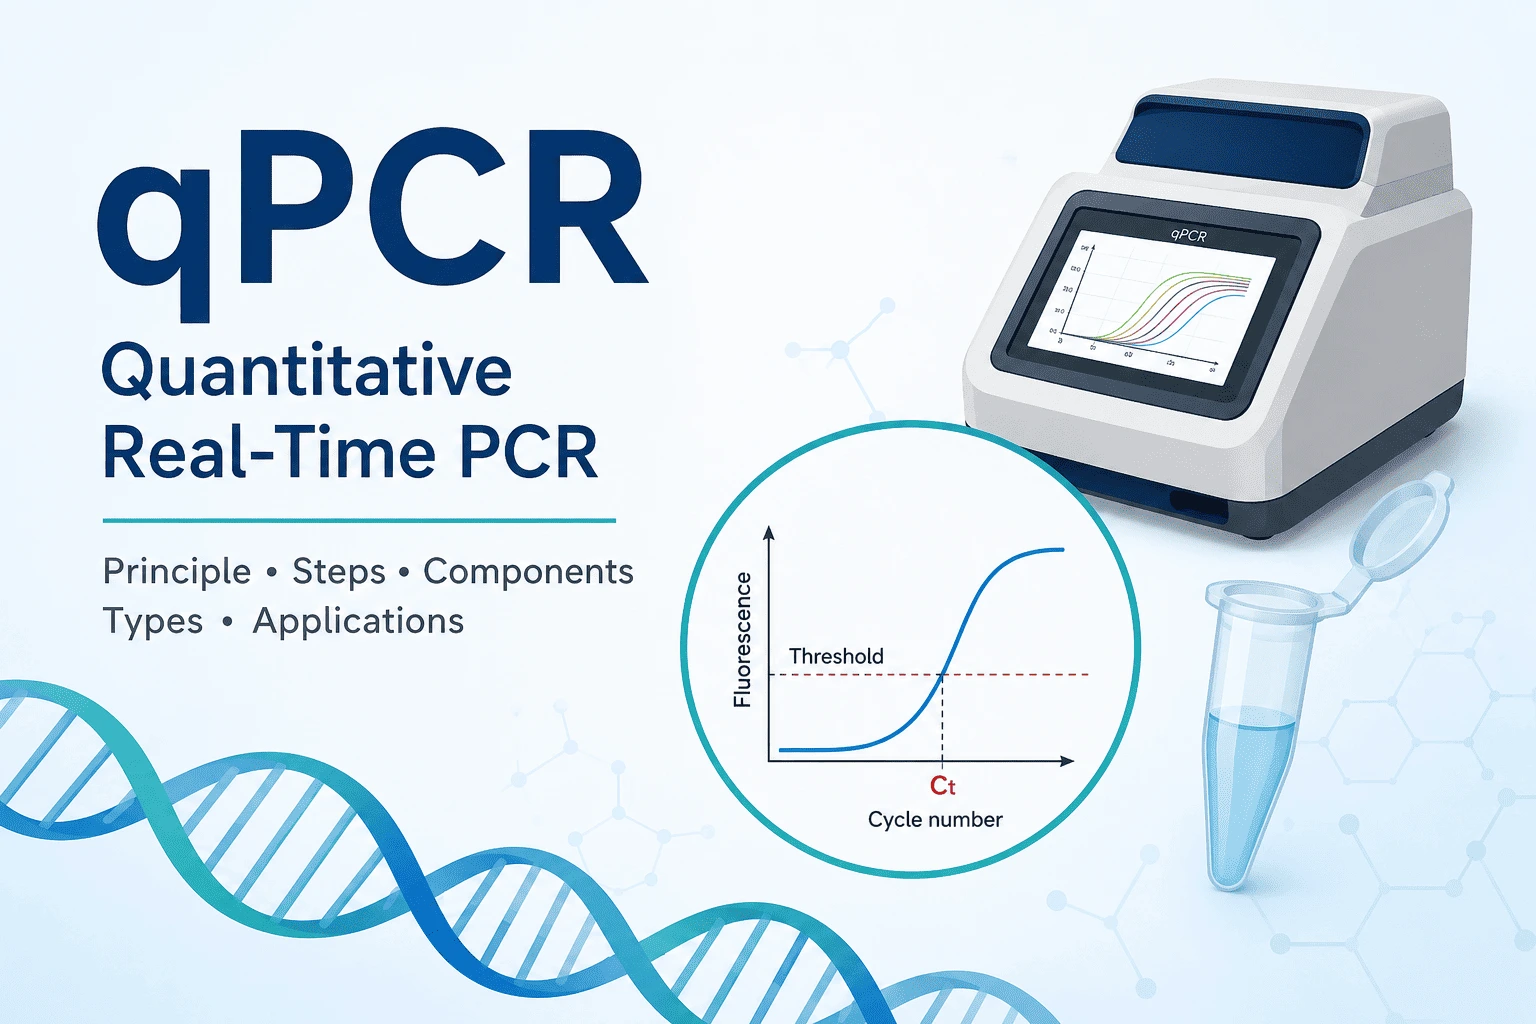
Quantitative polymerase chain reaction (qPCR), also called real-time PCR, is a molecular biology technique used to amplify and simultaneously quantify a specific DNA sequence. Unlike conventional PCR, which generally analyzes amplification after the reaction has finished, qPCR monitors DNA amplification during each cycle using fluorescent signals. This makes it possible to determine the amount of target nucleic acid present in a sample.
qPCR has become an essential technique in molecular biology, genetics, microbiology, biotechnology, cancer research, and clinical diagnostics. It can be used to quantify DNA, detect microorganisms, measure gene expression, determine pathogen load, investigate genetic alterations, and analyze biomarkers.
When the starting material is RNA, an additional reverse transcription step is required to convert RNA into complementary DNA (cDNA). The resulting technique is called reverse transcription quantitative PCR (RT-qPCR) and is widely used for gene expression studies.
This guide explains the principle of qPCR, its components, the main steps of the procedure, fluorescence detection, Ct/Cq values, quantification methods, applications, advantages, limitations, and common troubleshooting considerations.
What Is qPCR and How Does It Work?
Definition of qPCR
qPCR is a modified form of polymerase chain reaction that allows researchers to monitor the accumulation of amplified DNA in real time. The reaction uses primers, DNA polymerase, nucleotides, a DNA template, and a fluorescent detection system.
During amplification, the amount of target DNA increases. At the same time, fluorescence generated by the reaction is measured by a specialized real-time PCR instrument. The instrument records fluorescence after or during each amplification cycle and generates an amplification curve.
The term quantitative PCR refers to the ability to estimate the amount of target nucleic acid in the original sample based on the fluorescence signal generated during amplification.
Principle of qPCR
The basic amplification mechanism of qPCR is similar to conventional PCR. Each cycle generally consists of three major stages:
- Denaturation – double-stranded DNA is separated into single strands.
- Annealing – primers bind to complementary sequences on the target DNA.
- Extension – DNA polymerase synthesizes new DNA strands.
As the cycles continue, the target sequence is amplified. In qPCR, however, fluorescence is measured throughout the amplification process.
The fluorescence signal is initially very low and may remain close to the background level. As the amount of amplified DNA increases, the fluorescence eventually becomes detectable above the background. The point at which the fluorescence crosses a defined threshold is used to determine the Ct (cycle threshold) or Cq (quantification cycle) value.
Generally, a sample containing more starting target DNA reaches the threshold earlier and therefore has a lower Ct/Cq value. A sample containing less starting material usually requires more amplification cycles to reach the same threshold.
qPCR vs Conventional PCR
| Feature | Conventional PCR | qPCR |
|---|---|---|
| Detection | Usually endpoint | During amplification |
| Quantification | Limited/semi-quantitative | Quantitative |
| Fluorescence monitoring | Usually absent | Present |
| Amplification curve | No | Yes |
| Ct/Cq value | No | Yes |
| Gel electrophoresis | Often required | Often unnecessary |
| Typical applications | Amplification and detection | Quantification and detection |
The qPCR Amplification Curve
A typical qPCR amplification curve can be divided into several phases.
The baseline phase occurs at the beginning of the reaction, when fluorescence is close to background levels. The amount of amplified product is still too low to produce a clearly detectable signal.
The exponential phase occurs when amplification is highly efficient and the amount of target DNA increases rapidly. This phase is particularly important for quantitative analysis because the reaction is less affected by depletion of reagents.
The linear phase follows as amplification efficiency begins to decrease.
Finally, the reaction reaches a plateau phase, where amplification slows substantially because reagents become limiting and reaction products accumulate.
What Are Ct and Cq Values?
The Ct or Cq value represents the amplification cycle at which fluorescence crosses a predefined threshold.
Ct and Cq are commonly used interchangeably, although terminology can vary between instruments and laboratories.
The important relationship is that Ct/Cq is inversely related to the amount of starting template under comparable reaction conditions. A lower Ct generally indicates a greater initial amount of target nucleic acid, while a higher Ct generally indicates a lower initial amount.
However, Ct values should not automatically be interpreted as absolute measurements of target quantity. Reliable quantitative conclusions require appropriate controls, validated assays, consistent reaction conditions, and suitable analysis methods.
qPCR Components and Reagents
A successful qPCR reaction requires several essential components. The precise concentrations and reaction conditions depend on the assay, instrument, polymerase, primers, and sample type.
DNA Template
The template contains the target sequence that will be amplified. Depending on the experiment, it may be genomic DNA, plasmid DNA, cDNA, or another DNA preparation.
For RT-qPCR experiments, RNA is first converted into cDNA, which then serves as the template for qPCR.
Template quality is important because contaminants such as proteins, salts, phenol, ethanol, or other substances can interfere with amplification and produce unreliable results.
Primers
qPCR uses two primers: a forward primer and a reverse primer. These short DNA sequences define the region that will be amplified.
Primer design strongly influences assay specificity and efficiency. Poorly designed primers may produce nonspecific products or primer-dimers, whereas well-designed primers should preferentially amplify the intended target.
For many qPCR assays, relatively short amplicons are preferred because they can be efficiently amplified under appropriate conditions.
DNA Polymerase
A thermostable DNA polymerase synthesizes new DNA strands during the extension stage. qPCR commonly uses specialized polymerases optimized for real-time amplification.
Hot-start DNA polymerases are frequently used because they remain inactive at lower temperatures and become activated during an initial heating step. This can reduce nonspecific amplification and improve assay specificity.
dNTPs, Buffer, and Mg²⁺
The reaction contains the four deoxyribonucleotide triphosphates (dNTPs) required to synthesize DNA: dATP, dTTP, dCTP, and dGTP.
The reaction buffer provides an appropriate chemical environment for polymerase activity. Magnesium ions (Mg²⁺) are also essential for DNA polymerase function. Their concentration can influence amplification efficiency and specificity, so inappropriate magnesium concentrations may negatively affect assay performance.
Fluorescent Dyes and Probes
qPCR detection generally relies on one of two major fluorescence-based approaches: DNA-binding dyes or sequence-specific probes.
SYBR Green is a commonly used fluorescent dye. It binds to double-stranded DNA and produces increased fluorescence as amplified DNA accumulates. It is relatively simple and cost-effective, but the fluorescence is not specific to the intended product. Nonspecific products and primer-dimers can therefore contribute to the signal.
Probe-based assays, such as TaqMan assays, use a sequence-specific fluorescent probe that binds within the target region. Probe-based detection can provide greater specificity and also allows multiplex assays using different fluorescent labels.
Reaction Controls
Controls are essential for interpreting qPCR results.
A no-template control (NTC) contains all reaction components except the target template. It helps identify contamination or nonspecific amplification.
A positive control contains a known target and demonstrates that the assay is capable of producing the expected amplification.
Additional controls may be required depending on the experimental design. In RT-qPCR, for example, controls can help identify genomic DNA contamination or problems associated with the reverse transcription step.
qPCR Procedure: Step-by-Step Workflow
Sample Preparation and DNA or RNA Extraction
The workflow begins with collection and preparation of the biological sample. DNA or RNA is extracted using an appropriate method.
For DNA-based qPCR, the purified DNA can be used directly as the template if its concentration and quality are appropriate.
For gene expression experiments, RNA is extracted and subsequently converted into cDNA through reverse transcription.
Reverse Transcription for RT-qPCR
RNA cannot be directly amplified by conventional DNA polymerase-based PCR. Therefore, reverse transcription is used to convert RNA into complementary DNA.
The resulting cDNA is then used as the template for qPCR.
RT-qPCR is particularly important for measuring RNA expression, including messenger RNA (mRNA), viral RNA, and other RNA targets.
Preparing the qPCR Reaction
The qPCR mixture generally contains:
- DNA or cDNA template
- Forward primer
- Reverse primer
- DNA polymerase
- dNTPs
- Reaction buffer
- Magnesium ions
- Fluorescent dye or probe
- Nuclease-free water
Many laboratories use a commercially prepared qPCR master mix, which contains most of the required components. This simplifies reaction preparation and can improve consistency between samples.
Setting Up the qPCR Instrument
The prepared reactions are placed into compatible PCR tubes, strips, or plates and loaded into a real-time PCR instrument.
The instrument combines a thermal cycler with an optical detection system. During amplification, it controls the temperature cycles while measuring fluorescence from each reaction.
The appropriate fluorescent channel is selected according to the dye or probe used in the assay.
qPCR Thermal Cycling
Although exact conditions vary between assays, a typical qPCR program includes an initial activation or denaturation step followed by repeated amplification cycles.
Each cycle generally contains:
- Denaturation, which separates double-stranded DNA.
- Annealing, during which primers bind to their complementary sequences.
- Extension, during which DNA polymerase synthesizes the new DNA strand.
The exact temperatures, times, and number of cycles must be optimized for the specific assay.
Fluorescence Detection
The qPCR instrument measures fluorescence throughout the amplification process. As the quantity of target DNA increases, the fluorescence signal increases.
The resulting data are displayed as amplification curves. Software then calculates Ct/Cq values based on the defined threshold and baseline settings.
Melting Curve Analysis
Melting curve analysis is commonly used with SYBR Green assays to evaluate amplification specificity.
After amplification, the temperature is gradually increased, causing double-stranded DNA products to separate. Different DNA products can have different melting characteristics.
A single dominant melting peak at the expected temperature can support the presence of a specific amplification product, whereas additional peaks may indicate nonspecific products or primer-dimers.
Melting curve analysis does not replace proper assay validation, but it is a useful quality-control step for dye-based assays.
qPCR Data Analysis and Quantification
Understanding Ct/Cq Values
Ct/Cq values are among the most important outputs of a qPCR experiment.
For samples analyzed under comparable conditions, a lower Ct generally corresponds to a higher starting amount of target, while a higher Ct generally corresponds to a lower starting amount.
However, technical variation, amplification efficiency, sample quality, inhibitors, and assay performance can all affect Ct values.
For this reason, qPCR analysis should be based on an appropriate experimental design rather than simply comparing individual Ct values.
Relative Quantification
Relative quantification is widely used in gene expression studies to compare the expression of a target gene between experimental groups.
A reference gene, sometimes called a housekeeping gene, is used to normalize differences in sample input and other technical variation. The reference gene should be appropriately validated for stability under the experimental conditions.
One common approach is the ΔΔCt method.
First, the difference between the target gene Ct and reference gene Ct is calculated:
ΔCt = Ct(target) − Ct(reference)
The ΔCt of the experimental sample is then compared with the ΔCt of a calibrator or control sample:
ΔΔCt = ΔCt(experimental) − ΔCt(control)
When the assumptions of the method are satisfied, relative expression can be represented as:
Relative expression = 2⁻ΔΔCt
This value is commonly interpreted as fold change relative to the calibrator.
Absolute Quantification
Absolute quantification attempts to determine the actual quantity or copy number of a target.
A common approach uses a standard curve generated from samples containing known concentrations or copy numbers of the target. Ct values from unknown samples are then compared with the standard curve to estimate their target quantity.
Absolute quantification is useful in applications such as pathogen load measurement, plasmid quantification, and microbial analysis.
qPCR Standard Curves
A standard curve is typically generated using a series of known template concentrations. The Ct values are plotted against the logarithm of the starting template concentration.
The resulting relationship can be used to estimate unknown sample concentrations.
The slope of the standard curve can also provide information about amplification efficiency. An assay with appropriate efficiency should show a consistent relationship between template concentration and Ct.
qPCR Amplification Efficiency
Amplification efficiency describes how effectively the target is amplified during each cycle.
Under ideal conditions, a target would approximately double during each cycle, corresponding to 100% amplification efficiency.
Poor efficiency can result from factors such as suboptimal primer design, inhibitors, inappropriate reaction conditions, poor template quality, or technical problems.
Very high apparent efficiency can also indicate problems such as nonspecific amplification or experimental artifacts.
Quality Control of qPCR Results
Reliable qPCR experiments require careful quality control. Researchers should examine technical replicates, amplification curves, controls, assay efficiency, and specificity.
Unexpected amplification in an NTC, large differences between technical replicates, abnormal amplification curves, or nonspecific melting peaks may indicate problems that should be investigated before interpreting the results.
Types, Applications, Advantages, and Limitations of qPCR
Major Types of qPCR
Several qPCR approaches are commonly used.
SYBR Green qPCR uses a fluorescent DNA-binding dye and is relatively straightforward to perform.
Probe-based qPCR uses sequence-specific fluorescent probes and generally provides greater target specificity.
Multiplex qPCR detects multiple targets in a single reaction using different fluorescent signals.
RT-qPCR combines reverse transcription with quantitative PCR and is widely used for RNA and gene expression analysis.
Another related technology is digital PCR, which partitions a sample into many individual reactions and uses endpoint detection for highly precise nucleic acid quantification. Digital PCR and qPCR are complementary technologies rather than identical techniques.
Applications of qPCR
qPCR has numerous applications across biological and medical sciences.
- Gene expression research, RT-qPCR is commonly used to measure changes in mRNA levels between experimental conditions.
- Microbiology, qPCR can detect and quantify bacterial, fungal, or viral nucleic acids.
- Clinical diagnostics, real-time PCR assays can be used to detect specific pathogen sequences and other molecular targets.
- Cancer research, qPCR can help investigate gene expression, molecular biomarkers, genomic alterations, and changes in nucleic acid levels.
Other applications include GMO detection, environmental microbiology, food testing, genotyping, copy number analysis, and biotechnology research.
Advantages of qPCR
qPCR offers several important advantages:
- High sensitivity.
- High specificity when assays are properly designed.
- Quantitative measurement of nucleic acids.
- Rapid analysis.
- Wide dynamic range.
- Real-time monitoring of amplification.
- Reduced need for post-PCR gel electrophoresis.
- Compatibility with multiplex assays.
These characteristics have made qPCR one of the most widely used nucleic acid detection and quantification techniques.
Limitations of qPCR
Despite its advantages, qPCR has limitations.
The technique is highly dependent on assay design and reaction quality. Poor primers, inappropriate controls, inhibitors, contamination, and unstable reference genes can produce misleading results.
qPCR also requires specialized instrumentation and fluorescent reagents. In gene expression experiments, selecting appropriate reference genes and validating their stability is particularly important.
Furthermore, Ct values alone do not guarantee accurate quantification. Proper controls, assay validation, amplification efficiency, and appropriate statistical analysis are necessary for reliable conclusions.
Common qPCR Problems and Troubleshooting
Several problems can occur during qPCR experiments.
No amplification may result from poor template quality, incorrect primer design, inappropriate reaction conditions, or instrument/setup problems.
Very high Ct values can be associated with low target abundance, degraded template, inefficient amplification, or inhibitors.
Nonspecific amplification may result from poorly designed primers or unsuitable reaction conditions.
Primer-dimers can generate fluorescence in SYBR Green assays and may appear as additional peaks during melting curve analysis.
Poor amplification efficiency can be caused by primer problems, inhibitors, inappropriate concentrations, or suboptimal cycling conditions.
High variation between technical replicates may indicate pipetting errors, inadequate mixing, bubbles, inconsistent sample preparation, or other technical problems.
Troubleshooting should therefore consider the entire workflow, from nucleic acid extraction and assay design to reaction preparation, instrument settings, and data analysis.
Conclusion
qPCR is a powerful molecular biology technique that combines PCR amplification with real-time fluorescence detection to quantify specific nucleic acid targets. By monitoring amplification as it occurs, qPCR provides information that is not readily available from conventional endpoint PCR.
The technique depends on several critical components, including high-quality template, specific primers, DNA polymerase, nucleotides, appropriate buffers, and a reliable fluorescent detection system. Proper controls and assay validation are equally important for obtaining trustworthy results.
Ct/Cq values, amplification curves, standard curves, and amplification efficiency are central to qPCR data interpretation. Depending on the experimental objective, researchers can use relative quantification, such as the ΔΔCt method, or absolute quantification based on a standard curve.
From gene expression analysis and cancer research to pathogen detection and molecular diagnostics, qPCR remains an essential technique across modern biology. Understanding its principle, workflow, controls, and limitations is therefore fundamental for anyone working with molecular biology and nucleic acid analysis.


